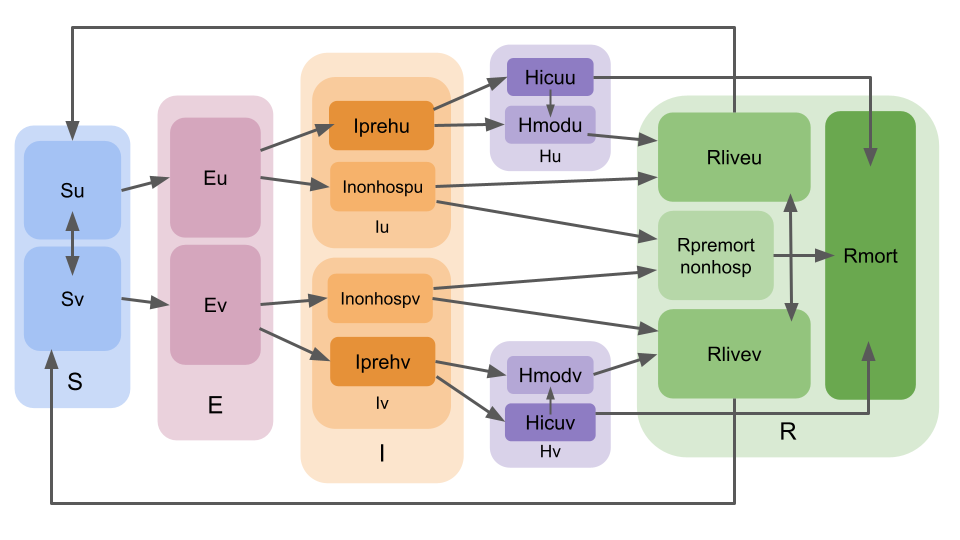
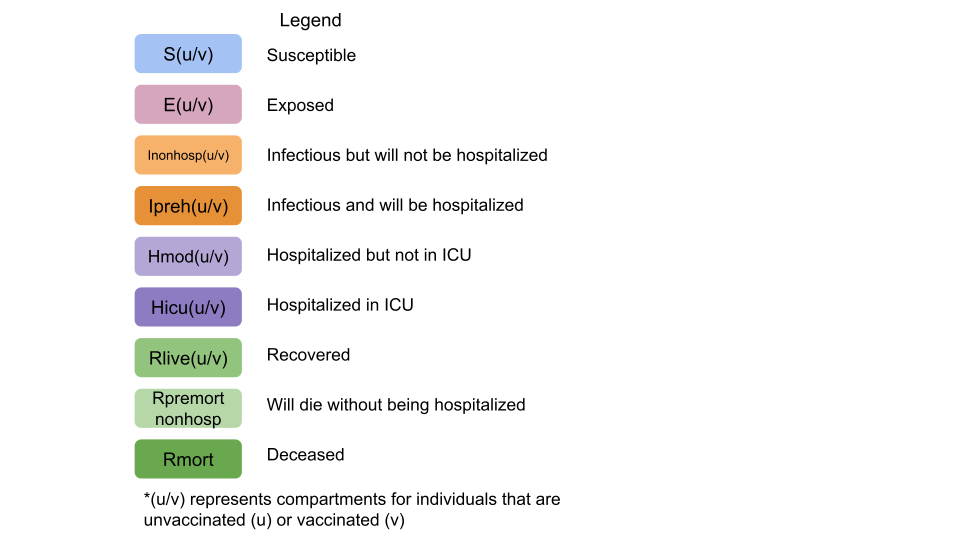
LEMMA (Local Epidemic Modeling for Management and Action) is designed to provide regional (e.g. city or county-level) projections of the SARS-CoV-2 (COVID-19) epidemic under various scenarios. Daily projections with uncertainty bounds are made for hospitalizations, ICU use active cases, and total cases. As detailed below, LEMMA allows for a range of user-specified parameterizations (including on the model structure) and is fit using case series data of COVID-19 hospital and ICU census, hospital admissions, deaths, cases and seroprevalence.
Omicron scenarios for California counties:
https://github.com/LocalEpi/LEMMA-Forecasts
Contributors
LEMMA is led by
- Joshua Schwab - UC Berkeley
- Maya L. Petersen - UC Berkeley
Additional core collaborators include
- Laura B. Balzer - UMass Amherst
- Elvin Geng - Washington University
- Diane Havlir - UC San Francisco
- James Peng - UC San Francisco
- Sophia Tan - UC Berkeley
- Sean L. Wu - UC Berkeley
Our original Stan implementation was based on the “Santa Cruz County COVID-19 Model” (https://github.com/jpmattern/seir-covid19) by Jann Paul Mattern (UC Santa Cruz) and Mikala Caton (Santa Cruz County Health Services Agency). We are very grateful to Paul and Mikala for generously sharing their code and helping us.
Installation
- Install RStudio. (https://rstudio.com/products/rstudio/download/#download)
- Create a folder to store your LEMMA inputs and outputs. For example, create a folder “MyFolder” within Documents.
- Install toolchain if needed.
If you do not have a toolchain including a C/C++ compiler, see here for installing one: https://support.rstudio.com/hc/en-us/articles/200486498 - Install LEMMA package.
install.packages("remotes")  #if you do not already have the remotes package
remotes::install_github("LocalEpi/LEMMA")- Copy and paste these lines into the RStudio console:
setwd("~/Documents/MyFolder")   # replace "~/Documents/MyFolder" with the path/folder you created
file.copy(system.file("extdata", "template.xlsx", package = "LEMMA", mustWork = TRUE), "example.xlsx", overwrite = TRUE)
If you get an error something like “lazy-load database ‘Library/R/3.6/library/LEMMA/R/LEMMA.rdb’ is corrupt” restart R and try step 3 again.
Running LEMMA
- Edit the Excel file ~/Documents/MyFolder/example.xlsx and save under a new name. For example, “MyCity.xlsx”
- Run the following code.
LEMMA::CredibilityIntervalFromExcel("MyCity.xlsx")Input
While all inputs can be given in R, the easiest way to get started with LEMMA is to use an Excel file input. The provided Excel spreadsheet provides a template and example of the inputs needed to run LEMMA. These are inputted in 10 sheets.
Sheet 1: Parameters with Distributions
Briefly, LEMMA requires parameters related to the epidemic modeling (e.g., basic reproductive number, duration of infectiousness, percent of infected persons who are hospitalized). LEMMA also allows the user to specify the timing and impact of public health interventions, such as school closures and shelter-in-place orders. Interventions may occur before the current date to reflect such public health interventions. Interventions may also occur after the current date and can be used to simulate epidemic if measures are implemented or lifted at a future date. Explanations for specific parameters are provided below. Users can input a mean and standard deviation for each parameter. Each parameter will be drawn from a normal distribution.
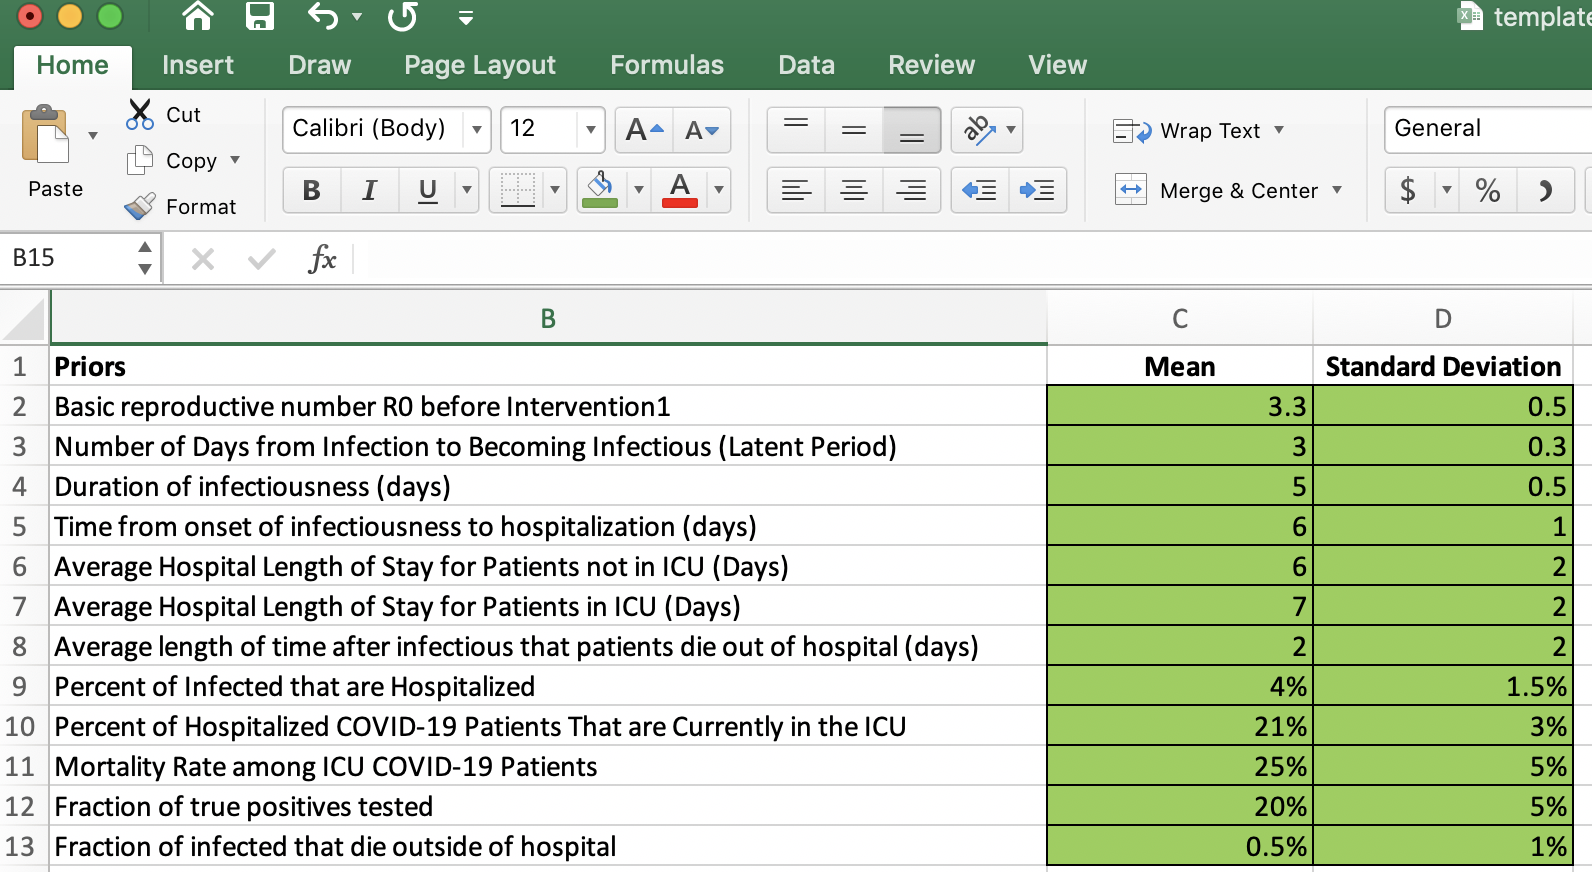
- Basic reproductive number R0 before Intervention1: initial epidemic growth before any public health interventions were implemented.
- Number of Days from Infection to Becoming Infectious (Latent Period)
- Duration of infectiousness (days)
- Time from onset of infectiousness to hospitalization (days)
- Average Hospital (non-ICU) Length of Stay for Patients (days)
- Average ICU Length of Stay (days): ICU patients will stay for this number of days in ICU and (if recover) transition to non-ICU for the above number of days
- Average length of time after infectious that patients die out of hospital (days): delay time for death outside of hospital (see Fraction of infected that die outside of hospital)
- Percent of Infected that are Hospitalized
- Percent of Hospitalized COVID-19 Patients That are Currently in the ICU
- Mortality Rate among ICU COVID-19 Patients
- Percent of true positives tested: detection rate
- Percent of infected that die outside of hospital: Most deaths occur from the ICU but some deaths may occur in persons not reaching the hospital. This is the fraction of all infected () that die but do not reach the hospital.
Total infection fatality rate = (Percent of Infected that are Hospitalized * Percent of Hospitalized COVID-19 Patients That are Currently in the ICU * Mortality Rate among ICU COVID-19 Patients) + Percent of infected that die outside of hospital
Sheet 2: Model Inputs
Specify the starting and final date of projections.
Note: total population was specified here in previous versions. Total population is now taken from the sum of age bracket populations on Vaccine Distribution
Sheet 3: Interventions
Interventions will be added automatically if not specified here. It is recommended to specify an intervention to represent initial lockdown with Re multiplier = 1/R0.
You can have any number of interventions. If you want more, just add rows using the same format.
- Intervention Date: Specify the date of the public health intervention. You can set standard deviation to near zero to indicate that the intervention definitely starts on a certain day, or set standard deviation to a positive number to indicate there is some uncertainty about when the intervention took/takes effect. Intervention Date can be in the past or in the future.
- Re Multiplier: Specify the impact of the first intervention in terms of multiplicative reductions in the basic reproductive number. Suppose this is 60%. Then the effective reproductive number after the first intervention would be Re = 0.6 * R0, where R0 is the basic reproductive number provided on the Parameters with Distributions sheet. If Re Multiplier for the second intervention is 50%, the effective reproductive number after the second intervention would be Re = 0.5 * 0.6 * R0.
- Days to reach new Re: LEMMA assumes the effects of interventions do not happen instantaneously. Therefore, specify the number of days to reach the new effective reproductive number.
Sheet 4: Data
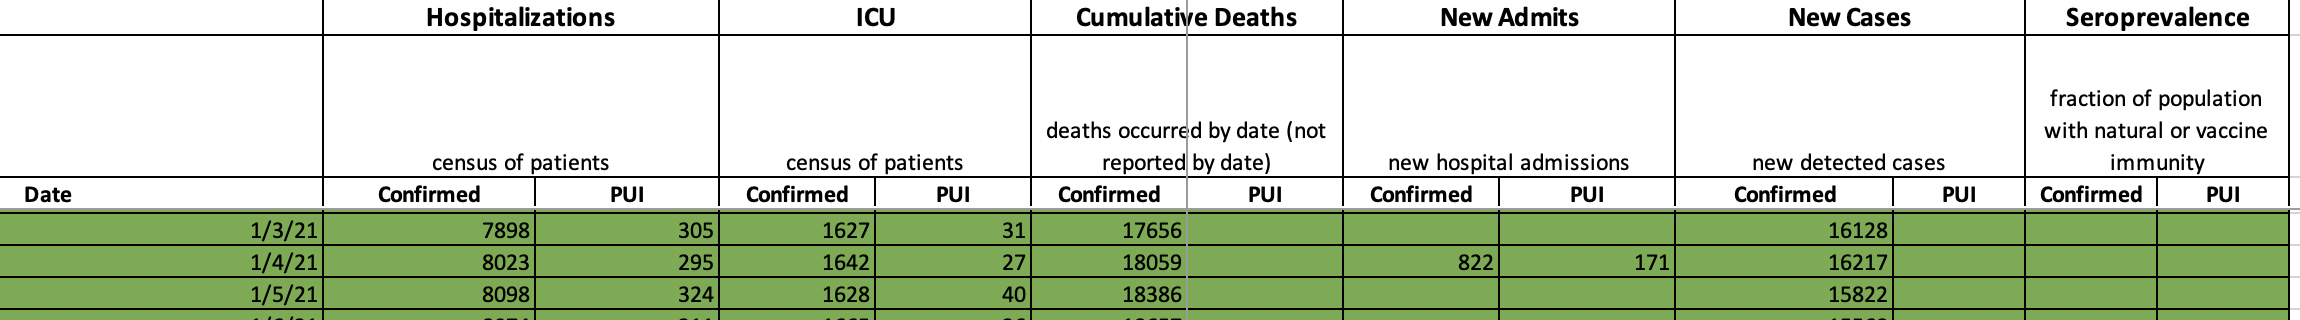 Provide hospital, ICU, death, cases, hospital admissions and/or seroprevalence time series data. PUI (Persons Under Investigation, or “Probable” cases) can be entered if available. Any entries (either an entire column or specific rows) can be left blank if the data is not available.
- Hospitalizations: Number of patients with COVID19 hospitalized on a given day, including those in ICU.
- ICU: Number of patients in ICU with COVID19 on a given day
- Cumulative Deaths: Total number of persons who have died due to COVID19 by a given day
- New Admits: Number of new patients who have been hospitalized (ICU or nonICU) with COVID19 on a given day (previous versions of LEMMA used cumulative admissions but LEMMA now uses new admissions)
- New Cases: Number of new detected COVID19 cases (e.g by PCR or antigen test)
- Seroprevalence: Percent of population with natural or vaccine immunity
Sheet 5: Vaccine Distribution
- Lower Bound of Age Group
- Percentage of Vaccinated: Number vaccinated to date in age bracket / Total number of vaccinated to date [NOTE: this is not the percentage of each bracket that has been vaccinated]
- Total Population: Number of residents in age bracket
- Vaccine Eligiblity Start Date: Date age bracket was or will be eligible to receive vaccines
- Maximum Uptake: Maximum percentage of age bracket that will be vaccinated
Sheet 6: Vaccine Doses - Observed
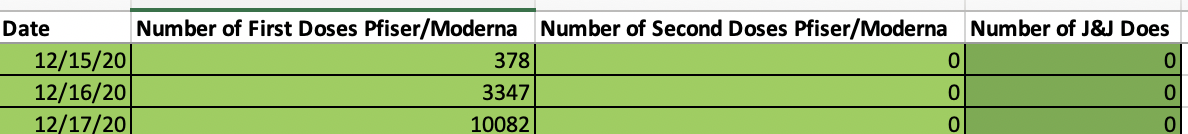
- Date
- Number of First Doses Pfizer/Moderna: number of new first Pfizer/Moderna doses given
- Number of Second Doses Pfizer/Moderna: number of new second Pfizer/Moderna doses given
- Number of J&J Doses: number of new (single) Johnson&Johnson doses given
Sheet 7: Vaccine Doses - Future
Future doses for (combined Pfizer and Moderna) and Johnson&Johnson
- Date to Begin Increasing Vaccinations: date doses increase beyond baseline
- Baseline Number of Daily Doses: number of doses per day after observed doses and before Date to Begin Increasing Vaccinations
- Daily Increase in Number of Doses: daily increase (if negative, decrease)
- Maximum Doses per Day: maximum number that will be given on any day
Sheet 8: Variants
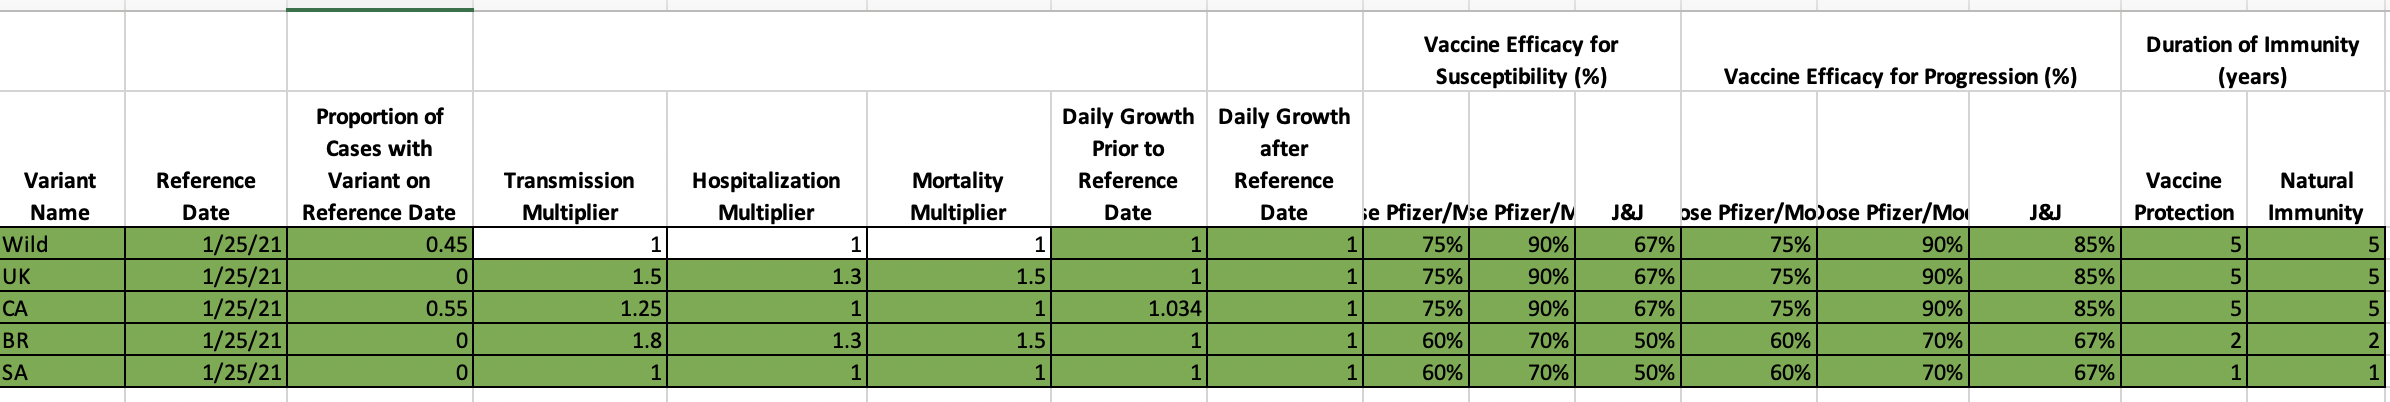 Note: All vaccine/variant values are modelled as fixed quantities, not parameters with distributions to be estimated
- Variant Name: name given does not affect projections
- Reference Date: date on which proportion of cases with variant is considered known
- Proportion of Cases with Variant on Reference Date: should add to 100%
- Transmission Multiplier: e.g. 1.5 = variant is 50% more transmissable than wild-type/ancestral strain
- Hospitalization Multiplier: e.g. 1.3 = variant causes 30% more hospitalizations per infection than wild-type/ancestral strain
- Mortality Multiplier: e.g. 1.4 = variant causes 40% more deaths per infection than wild-type/ancestral strain [note: this is the increase in deaths per infection, not in deaths per ICU or deaths per hospitalization]
- Daily Growth Prior to Reference Date: e.g. 1.03 = variant was growing by 3% per day before Reference Date
- Daily Growth after Reference Date: e.g. 1.04 = variant grows by 4% per day after Reference Date
The following can be specified separately for 1 or 2 doses of Pfizer/Moderna and (single dose of) Johnson&Johnson
- Vaccine Efficacy for Susceptibility (%): e.g. 85% = 85% of persons who would otherwise have become infected will not become infected, pass on infection, become hospitalized or die
- Vaccine Efficacy for Progression (%): 90% = 90% of persons who would otherwise have been hospitalized or die will not (they will either not get infected or will have a mild infection). Vaccine Efficacy for Progression can not be less than Vaccine Efficacy for Susceptibility.
If Vaccine Efficacy for Susceptibility = 85% and Vaccine Efficacy for Progression = 90% this implies that the efficacy for progression conditional on infection is1 - (1 - 0.9) / ( 1 - 0.85) = 33%.
- Duration of Immunity (years) - Vaccine Protection: average duration of immunity from (any) vaccine. e.g. 5 years = 1/5 of persons who are vaccinated will lose all protection after 1 year
- Duration of Immunity (years) - Natural Immunity: average duration of immunity after recovery from infection. e.g. 3 years = 1/3 of persons who are vaccinated will lose all protection after 1 year
Sheet 9: PUI Details
If PUIs are used on the Data sheet, a mean for the fraction of PUIs who are actually COVID19 positive can be entered. If PUIs are not used for a given category on the Data sheet, the mean for that category on the PUI Details sheet will be ignored.
Sheet 10: Internal
- random.seed
- output.filestr: output filename (without extension)
- add.timestamp.to.filestr
- simulation.start.date: date at beginning of pandemic with small number of exposed, all other persons susceptible
- plot.observed.data.long.term
- plot.observed.data.short.term
- automatic.interventions: if TRUE, add interventions at regular intervals
- optimize.iter: passed to rstan::optimize, maximum number of iterations (changing not recommended)
- hide.nonpublic.data: hides observed seroprev in outputs (these estimates are not public in California)
This allows for more nuanced changes including changing the file names (output.filestr) and plotting details (plot.observed.data.long.term, plot.observed.data.short.term).
Output
Previous versions of LEMMA calculated crediblity intervals and reported quantiles. The current version only calculates a point estimate by maximizing the joint posterior. Future versions may include crediblity intervals again as an option.
PDF output
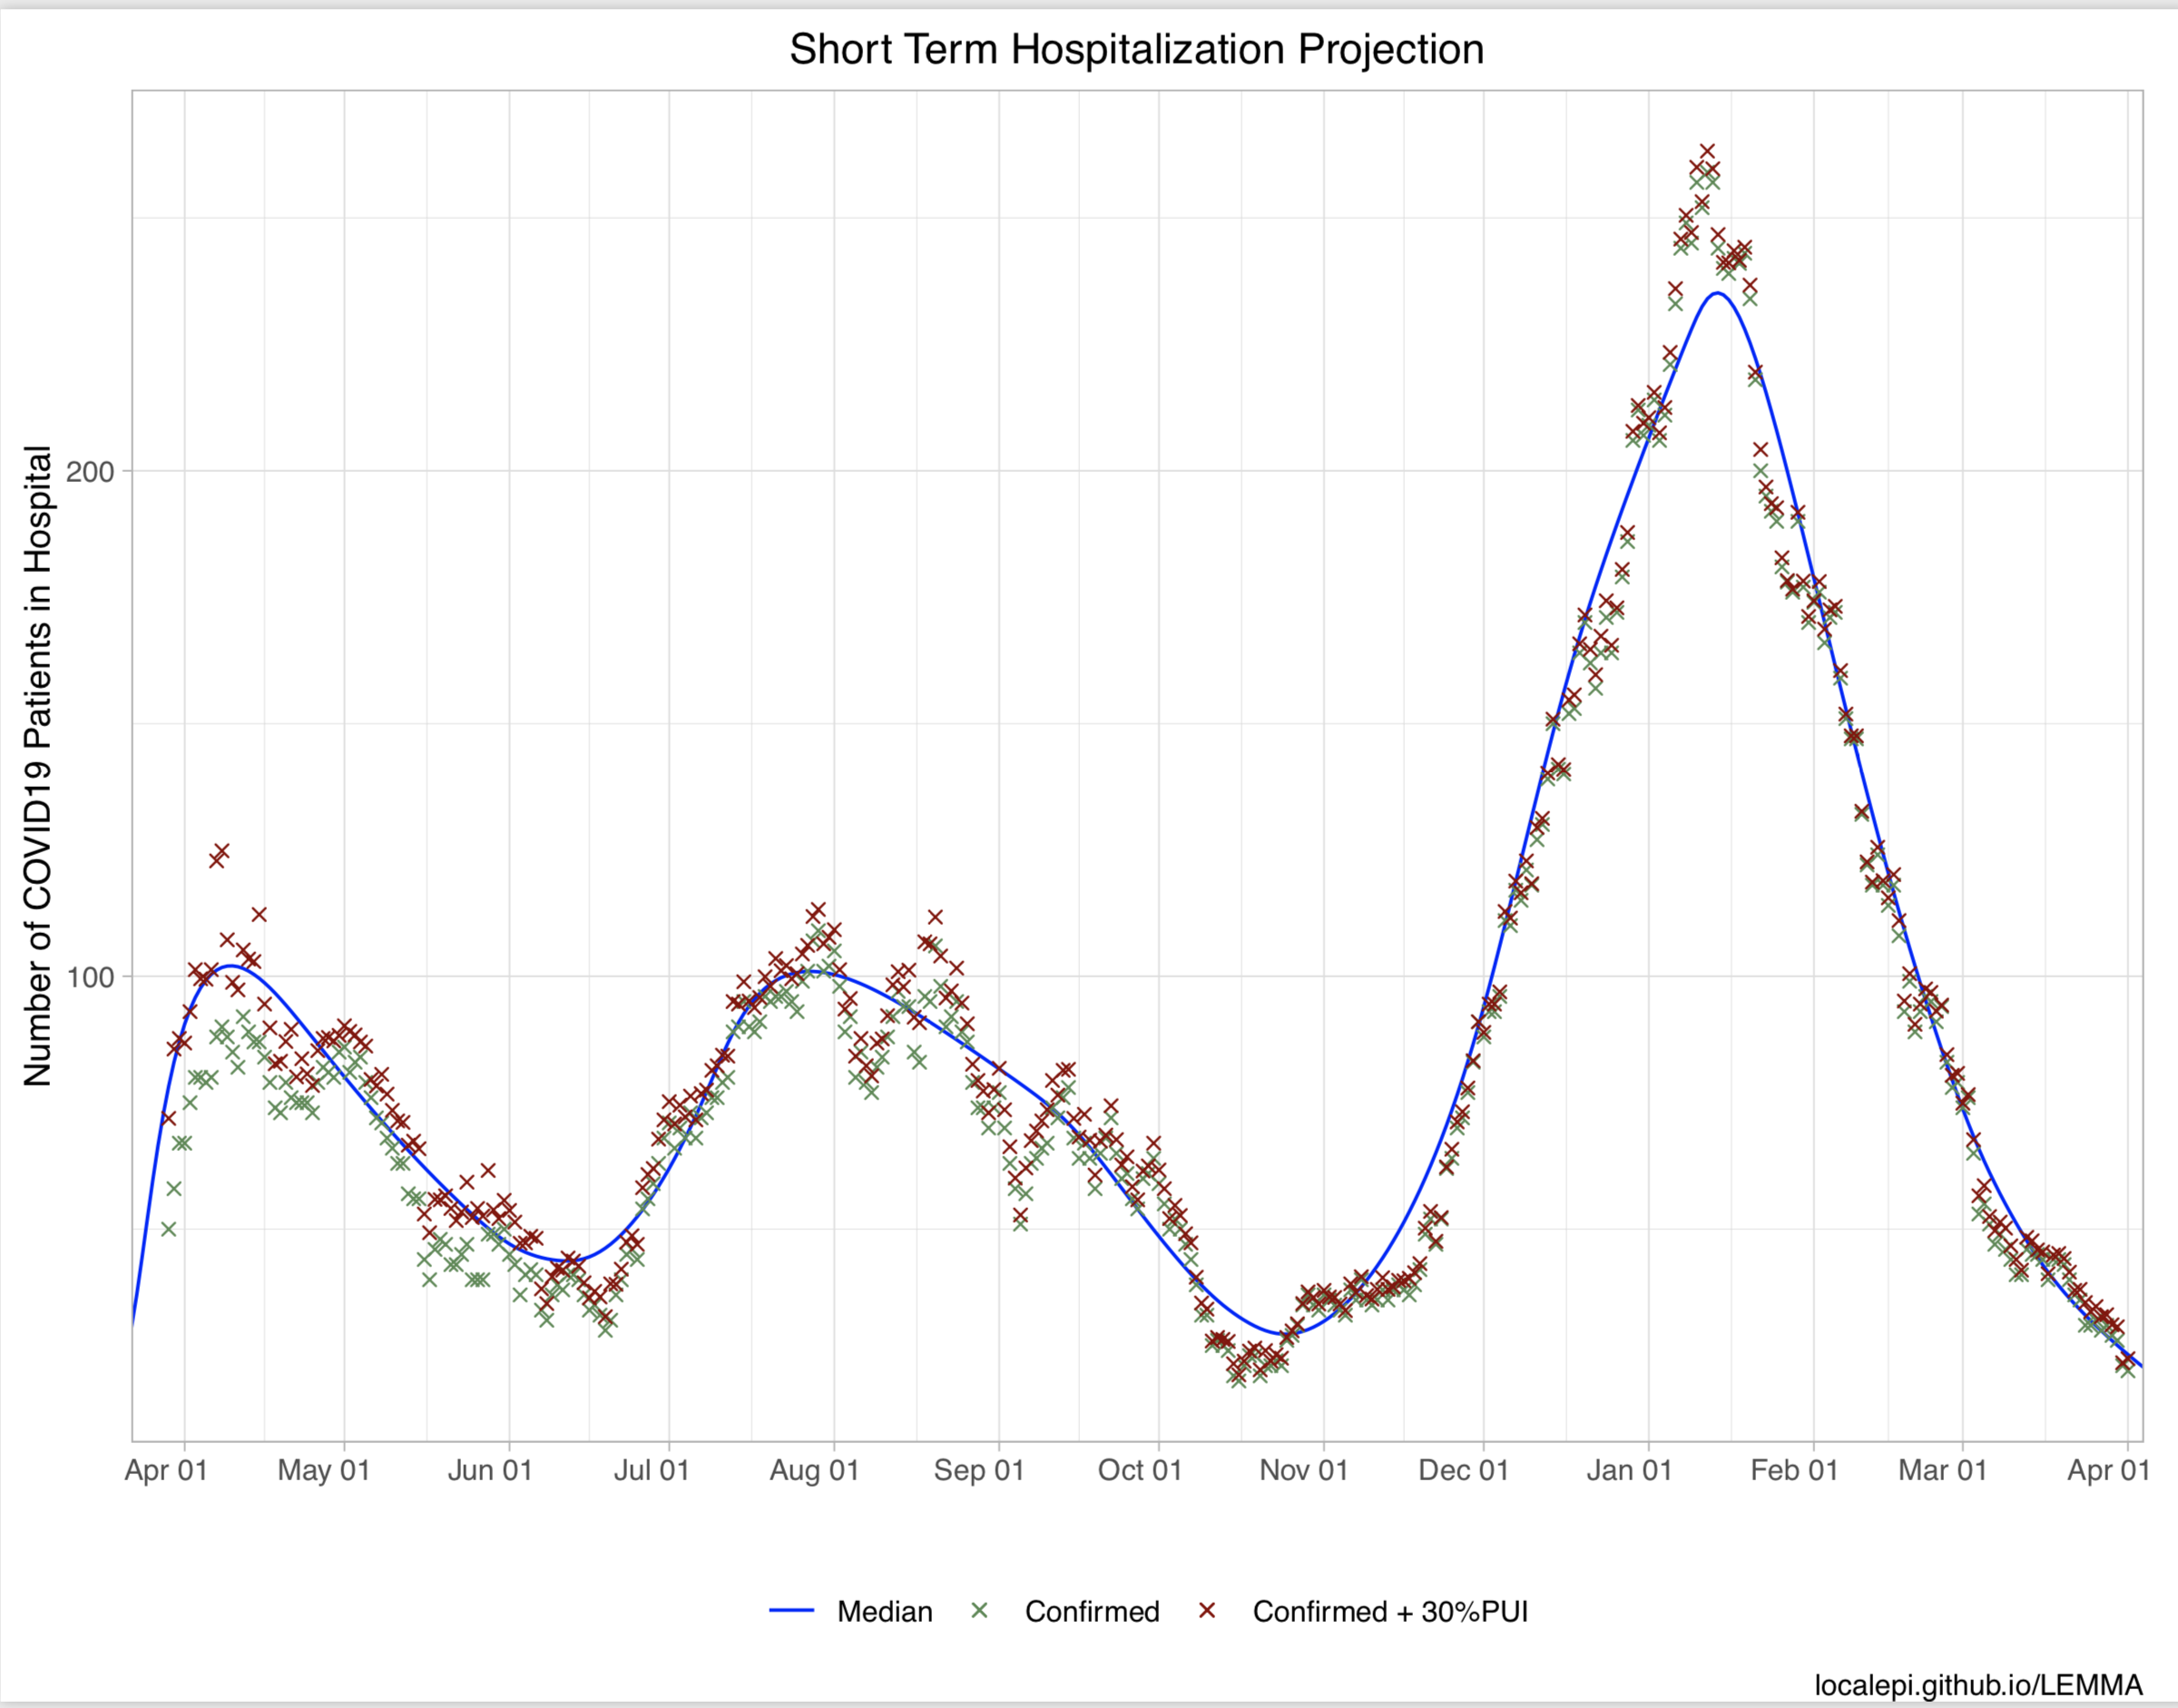
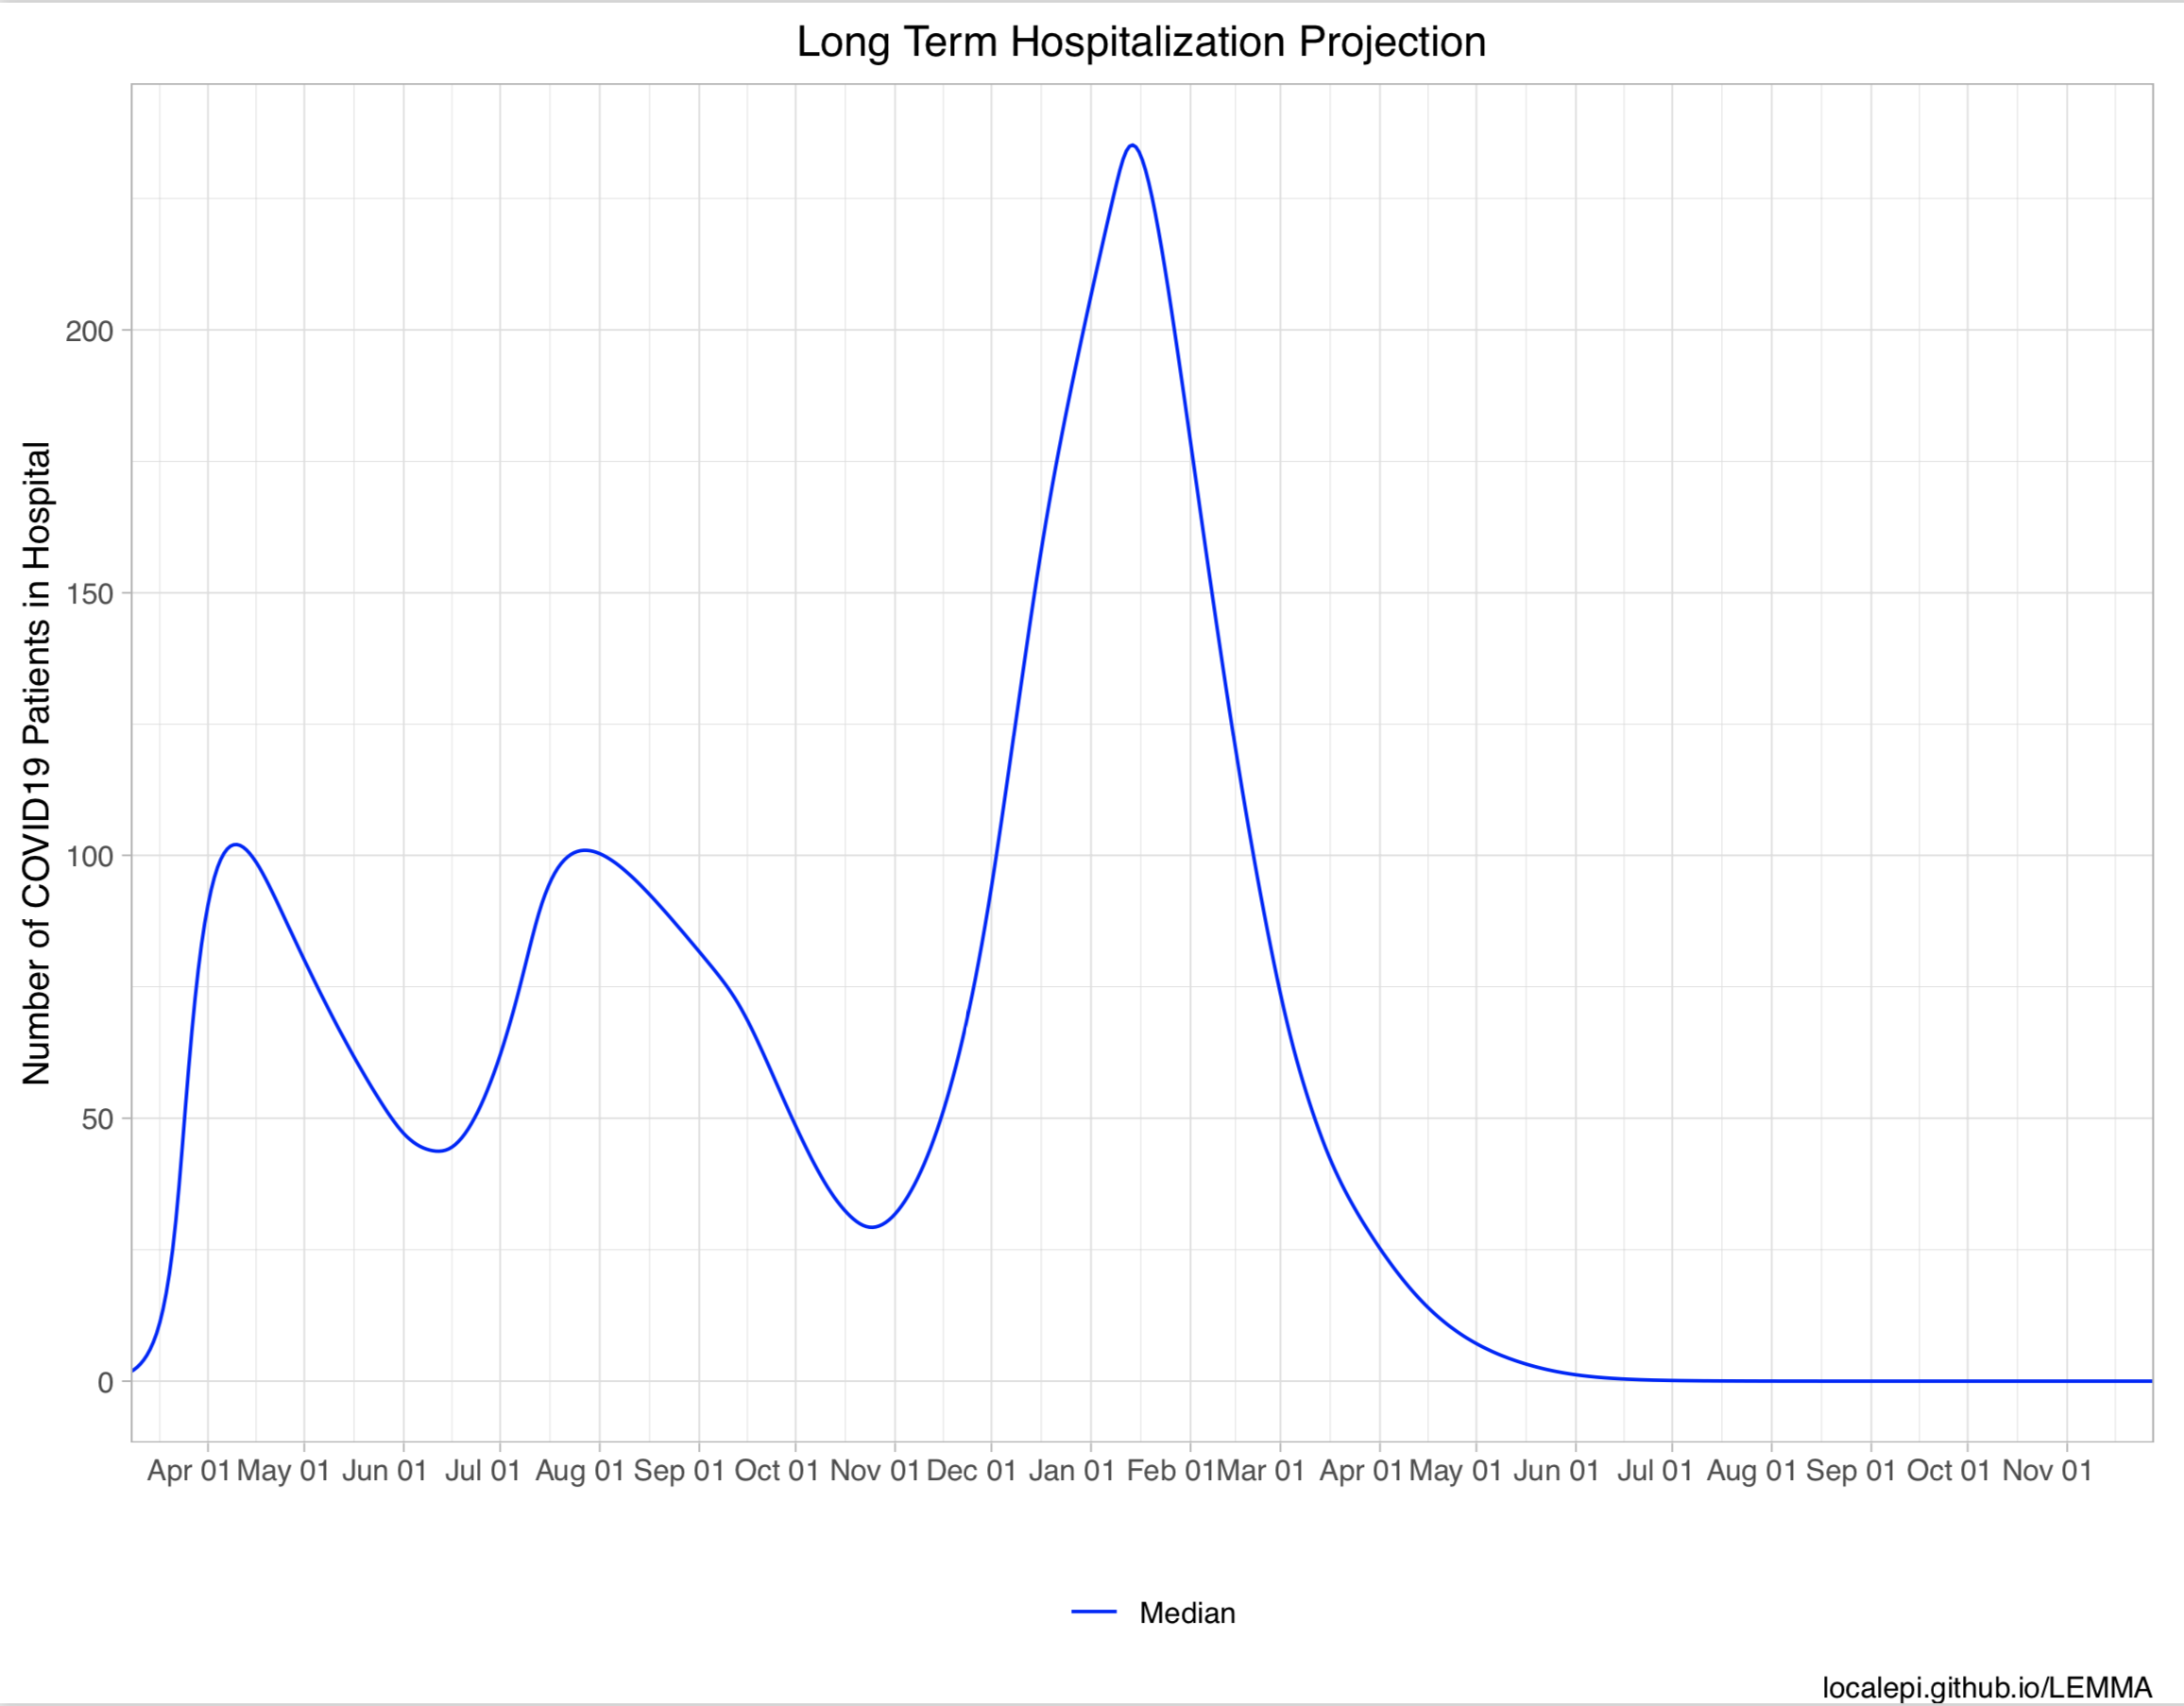
The main output is provided in pdf format. Plots include short term and long term projections for number hospitalized, in the ICU, cumulative deaths, new hospital admissions, detected cases and seroprevalence (these are only shown for categories in which data was entered on the Data sheet). A plot of Re over time is shown up to 14 days before the last observed data. It is difficult to estimate Re beyond that date because it takes at least two weeks for changes in Re to be reflected in hospitalizations.
Detailed outputs are provided in Excel format.
Sheet 1: Projection
The outputs on the “projection” sheet are all raw values, except seroprev and rt.
- hosp: hospital census
- icu: ICU census
- deaths: cumulative deaths
- admits: new admits
- cases: new detected cases [to match the cases inputs]
- seroprev: fraction (0 to 1) of population with natural or vaccine immunity
- rt: effective reproductive number
- exposed: number currently exposed
- infected: number currently infected
- activeCases: true cases (not just detected) - exposed, infected, hospitalized
- totalCases: true cases (not just detected) - ever exposed/infected/hospitalized [could include reinfections] + deaths
- susceptibleUnvax: susceptible and unvaccinated
- vaccinated: number with vaccine immunity
FAQ
https://localepi.github.io/LEMMA/articles/faq.html
License
The MIT License (MIT)
Copyright (c) 2021 LEMMA
Permission is hereby granted, free of charge, to any person obtaining a copy of this software and associated documentation files (the “Software”), to deal in the Software without restriction, including without limitation the rights to use, copy, modify, merge, publish, distribute, sublicense, and/or sell copies of the Software, and to permit persons to whom the Software is furnished to do so, subject to the following conditions:
The above copyright notice and this permission notice shall be included in all copies or substantial portions of the Software.
THE SOFTWARE IS PROVIDED “AS IS”, WITHOUT WARRANTY OF ANY KIND, EXPRESS OR IMPLIED, INCLUDING BUT NOT LIMITED TO THE WARRANTIES OF MERCHANTABILITY, FITNESS FOR A PARTICULAR PURPOSE AND NONINFRINGEMENT. IN NO EVENT SHALL THE AUTHORS OR COPYRIGHT HOLDERS BE LIABLE FOR ANY CLAIM, DAMAGES OR OTHER LIABILITY, WHETHER IN AN ACTION OF CONTRACT, TORT OR OTHERWISE, ARISING FROM, OUT OF OR IN CONNECTION WITH THE SOFTWARE OR THE USE OR OTHER DEALINGS IN THE SOFTWARE.